Pair distribution functions and structure factors
The pair distribution function (or pair correlation function) of a material describes the probability of finding an atom at a separation r from another atom.
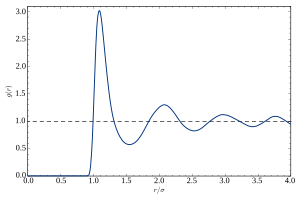
A typical plot of g versus r of a liquid or glass shows a number of key features:
- At short separations (small r), g(r) = 0. This indicates the effective width of the atoms, which limits their distance of approach.
- A number of obvious peaks and troughs are present. These peaks indicate that the atoms pack around each other in 'shells' of nearest neighbors. Typically the 1st peak in g(r) is the strongest feature. This is due to the relatively strong chemical bonding and repulsion effects felt between neighboring atoms in the 1st shell.
- The attenuation of the peaks at increasing radial distances from the center indicates the decreasing degree of order from the center particle. This illustrates vividly the absence of "long-range order" in liquids and glasses.
- At long ranges, g(r) approaches a limiting value of 1, which corresponds to the macroscopic density of the material.
The static structure factor, S(q), which can be measured with diffraction techniques, is related to its corresponding g(r) by Fourier transformation
-
(1)

where q is the magnitude of the momentum transfer vector, and ρ is the number density of the material. Like g(r), the S(q) patterns of liquids and glasses have a number of key features:
- For mono-atomic systems the S(q=0) limit is related to the isothermal compressibility. Also a rise at the low-q limit indicates the presence of small angle scattering, due to large scale structure or voids in the material.
- The sharpest peaks (or troughs) in S(q) typically occur in the q=1-3 Angstrom range. These normally indicate the presence of some medium range order corresponding to structure in the 2nd and higher coordination shells in g(r).
- At high-q the structure is typically a decaying sinusoidal oscillation, with a 2π/r1 wavelength where r1 is the 1st shell peak position in g(r).
- At very high-q the S(q) tends to 1, consistent with its definition.
Diffractionedit
The absence of long-range order in liquids and glasses is evidenced by the absence of Bragg peaks in X-ray and neutron diffraction. For these isotropic materials, the diffraction pattern has circular symmetry, and in the radial direction, the diffraction intensity has a smooth oscillatory shape. This diffracted intensity is usually analyzed to give the static structure factor, S(q), where q is given by q=4πsin(θ)/λ, where 2θ is the scattering angle (the angle between the incident and scattered quanta), and λ is the incident wavelength of the probe (photon or neutron). Typically diffraction measurements are performed at a single (monochromatic) λ, and diffracted intensity is measured over a range of 2θ angles, to give a wide range of q. Alternatively a range of λ, may be used, allowing the intensity measurements to be taken at a fixed or narrow range of 2θ. In x-ray diffraction, such measurements are typically called “energy dispersive”, whereas in neutron diffraction this is normally called “time-of-flight” reflecting the different detection methods used. Once obtained, an S(q) pattern can be Fourier transformed to provide a corresponding radial distribution function (or pair correlation function), denoted in this article as g(r). For an isotropic material, the relation between S(q) and its corresponding g(r) is
-
(2)

The g(r), which describes the probability of finding an atom at a separation r from another atom, provides a more intuitive description of the atomic structure. The g(r) pattern obtained from a diffraction measurement represents a spatial, and thermal average of all the pair correlations in the material, weighted by their coherent cross-sections with the incident beam.
Atomistic simulationedit
By definition, g(r) is related to the average number of particles found within a given volume of shell located at a distance r from the center. The average density of atoms at a given radial distance from another atom is given by the formula:
-
(3)

where n(r) is the mean number of atoms in a shell of width Δr at distance r. The g(r) of a simulation box can be calculated easily by histograming the particle separations using the following equation
-
(4)

where Na is the number of a particles, |rij| is the magnitude of the separation of the pair of particles i,j. Atomistic simulations can also be used in conjunction with interatomic pair potential functions in order to calculate macroscopic thermodynamic parameters such as the internal energy, Gibbs free energy, entropy and enthalpy of the system.

Comments
Post a Comment